Data Journalism
Chris Knox
Data Editor at the New Zealand Herald (in August 2019)
chris@functionalvis.com
22 September, 2019
Income data
- Upload
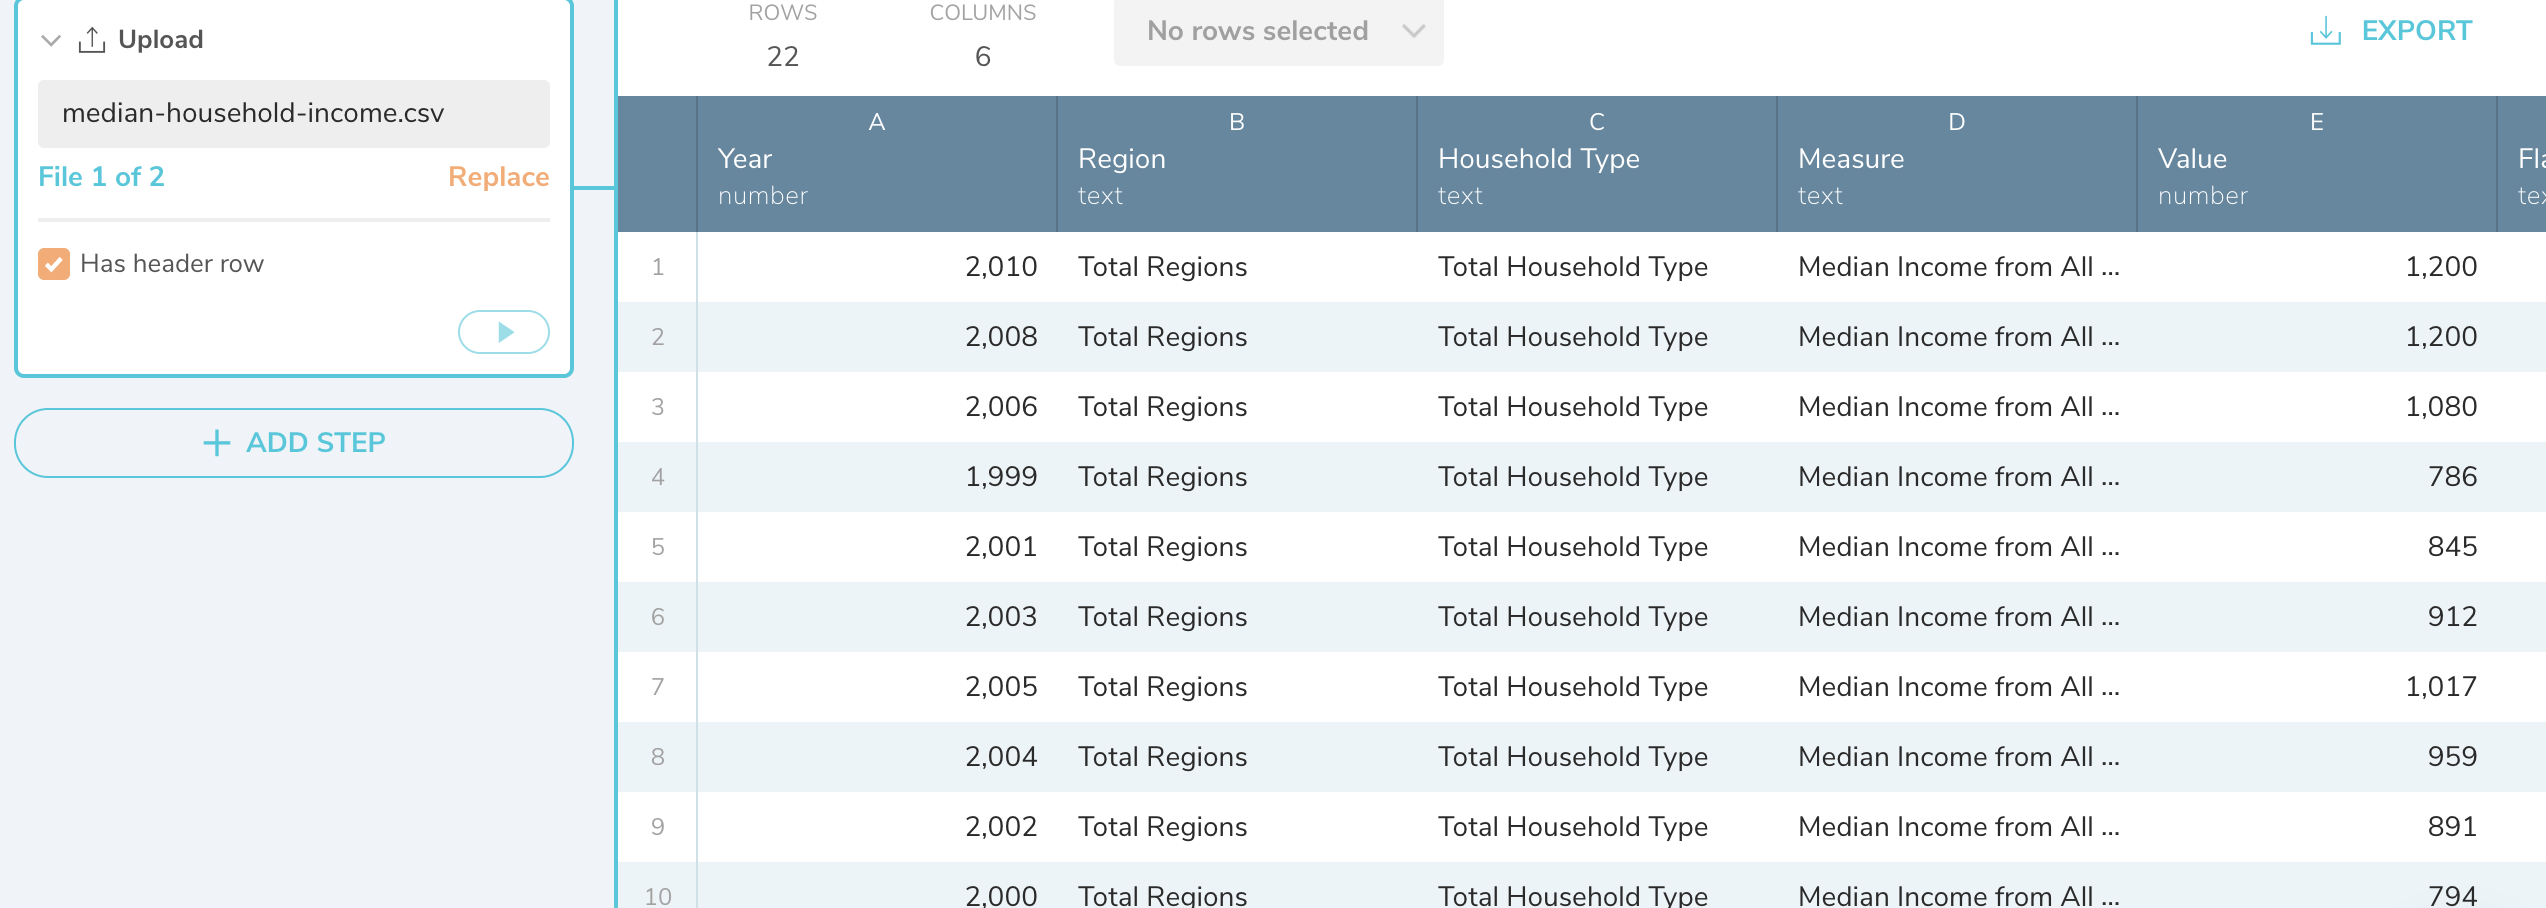
- Grrr commas in year
- Convert year column to date
- Actually not the right thing - we will come back to this
- Results of conversion
- Select Year and Value
- Convert weekly income to annual
- Drop value column
CPI data
(We did this yesterday)
- Use a new tab
- Upload
- Remove extra row
- And rename while we are cleaning up
- Filter out Q1,Q3,Q4
- It doesn’t matter which quarter - just be consistent
- It doesn’t matter which quarter - just be consistent
- Filter using text contains
- Let’s shorten the CPI column name
- Another rename
- Ohh lost filter
- Set column again
- Set column again
Joining time
Start a new tab for joining
- Leave data loading tabs for data loading
Start a new tab using an existing tab
Join to the other tab
Ohoh not ready yet
Columns need to match
- Type, name, and content
- Type, name, and content
Turn the year into a number without formatting
- Could do this back at beginning
- Could do this back at beginning
Remove Q2 from years
Convert to number without formatting
Rename to Year
Hooray
Oh Index is text
Calculation time
- Index is designed so it provides a ratio
- Think about whether number should get bigger or smaller
Divide through by year’s index
Multiple by index now
Tidy up
Look charts
Does that look right?
Stories in police data
Look at trends
- Use the little plus to expand
- See more levels
- Select a level
- Select a sublevel
- What is happening?
- How can we download?
- Don’t download the summary
- Download the full data
- What if we want to look at cities?
- Police stations report
- Use the variance to look for big changes
- Sort by variance
- Ignore big changes in small numbers
- Ignore big changes in small numbers
- Select the cities you are interested in
- Lower Hutt and Wellington too
- Lower Hutt and Wellington too