Recap
Datawrapper
- Styling
- Chart choice
- Transpose
- Maps
What is a visualisation?
Using the visual modes available; size, colour, shape, and position to represent (encode) the values in the data.
It it usual for quantities to be proportional to the area of the visual encoding - this makes circles very poor
for accurate comparisons of values.
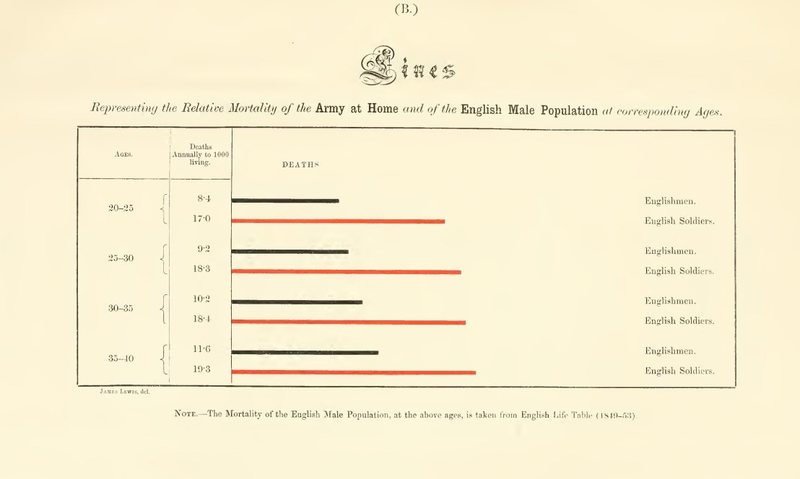
It’s actually quite old
Drawing time
2017 Election Party Vote
| Party | Votes | Percent |
|---|
| National Party | 1,152,075 | 44.4 |
| Labour Party | 956,184 | 36.9 |
| New Zealand First Party | 186,706 | 7.2 |
| Green Party | 162,443 | 6.3 |
| The Opportunities Party (TOP) | 63,261 | 2.4 |
| Māori Party | 30,580 | 1.2 |
| ACT New Zealand | 13,075 | 0.5 |
| Aotearoa Legalise Cannabis Party | 8,075 | 0.3 |
| Conservative | 6,253 | 0.2 |
| MANA | 3,642 | 0.1 |
| Ban1080 | 3,005 | 0.1 |
| New Zealand People’s Party | 1,890 | 0.1 |
| United Future | 1,782 | 0.1 |
| NZ Outdoors Party | 1,620 | 0.1 |
| Democrats for Social Credit | 806 | 0.0 |
| Internet Party | 499 | 0.0 |
2017 Election Party Vote by Voting Type
| Type | Votes | Percent |
|---|
| Election Day | 1,151,123 | 44.4 |
| Advance | 1,022,793 | 39.5 |
| Special | 375,726 | 14.5 |
| Party Only | 42,254 | 1.6 |
2017 Election Party Vote by Voting Type and Party
Advance Voting
| Party | Type | Votes | Percent of type | Percent of party |
|---|
| ACT New Zealand | Advance | 4,690 | 0.5 | 35.9 |
| Green Party | Advance | 64,172 | 6.5 | 39.5 |
| Labour Party | Advance | 375,298 | 38.2 | 39.2 |
| National Party | Advance | 464,939 | 47.3 | 40.4 |
| New Zealand First Party | Advance | 72,979 | 7.4 | 39.1 |
Election Day Voting
| Party | Type | Votes | Percent of type | Percent of party |
|---|
| ACT New Zealand | Election Day | 6,283 | 0.6 | 48.1 |
| Green Party | Election Day | 63,609 | 5.8 | 39.2 |
| Labour Party | Election Day | 402,962 | 36.7 | 42.1 |
| National Party | Election Day | 534,259 | 48.6 | 46.4 |
| New Zealand First Party | Election Day | 91,149 | 8.3 | 48.8 |
Party only votes
| Party | Type | Votes | Percent of type | Percent of party |
|---|
| ACT New Zealand | Party Only | 153 | 0.4 | 1.2 |
| Green Party | Party Only | 2,633 | 6.8 | 1.6 |
| Labour Party | Party Only | 22,144 | 57.0 | 2.3 |
| National Party | Party Only | 11,149 | 28.7 | 1.0 |
| New Zealand First Party | Party Only | 2,789 | 7.2 | 1.5 |
Special votes
| Party | Type | Votes | Percent of type | Percent of party |
|---|
| ACT New Zealand | Special | 1,949 | 0.6 | 14.9 |
| Green Party | Special | 32,029 | 9.1 | 19.7 |
| Labour Party | Special | 155,780 | 44.3 | 16.3 |
| National Party | Special | 141,728 | 40.3 | 12.3 |
| New Zealand First Party | Special | 19,789 | 5.6 | 10.6 |
Bad or deceiving charts
- Charts and graphs can be used to deceive
The best way to get a sense for bad charts is to peruse vis.wtf or /r/dataisugly. There is also a good writeup here
In the New Zealand context Stats Chat is great.
The most common bad things are:
- Incorrect, missing, or misleading labels
- Inconsistenct scales
- Truncating scales
- Comparing things that shouldn’t be
- Too many things
A few rules
- Barcharts always start at 0
- Line charts don’t need to start at 0, but always ask yourself if the range you select is going to
make an insignificant change look important
- Only use pie charts for parts of a whole and only when there are less than 5 categories
- Avoid maps for showing quantities
- LABELS
Exercise
Pick a couple of charts from Figure.NZ and remake it.
- Have you made them better or worse?
- If you have improved them is the data being shown in a different way?
Telling stories with data
Video examples
Interactive examples
Breakout
In pairs discuss these:
- What do you think of these approaches?
- Do you like them?
- Are there other ways you would prefer to learn about this data?
- Are they journalism?
- Are they news?
NZH Improvements
I probably should have included a median income version as well as an average income version.
Digressions — Why?
All summary statistics hide things
The mean and standard deviation are the same for each of these graphs
Accessment
- Select some data with two variables from Figure.NZ
- Clean and reshape the data in Workbench
- Export the data to Datawrapper and create a chart
- Email the chart link to chris.knox@nzherald.co.nz and share the Workbench workflow with me
- Include a sentence about why you choose this data - why would it be newsworthy
- If you changed to chart type from the Figure.NZ default include a sentence about why you choose that chart type.