Data Journalism
Chris Knox
Data Editor at the New Zealand Herald (in August 2020)
chris@functionalvis.com
06 August, 2020
Shout-out
Unsplash is a fantastic source of freely-usuable images.
I really like Martin Reisch’s aerial photographs - I feel like they capture something of what data journalism should be doing - showing a bunch of shapes and abstractions while keeping people in the frame.
Recap
Today’s recap is an annotated demo workflow
Tabs
- StatsNZ Covid Data
- show how to fix the dates, convert the numbers and filter down to a single indicator
- Weekly deaths
- Use reshape to get the data ready for plotting
- Chickens
- Chicken chart from Figure.NZ
- Baby names
- History of current top 6 baby names using a full dataset downloaded from Figure.NZ
- Baby names - regex
- A more advanced but easier way to filter out 6 baby names
Also don’t forget to look at Workbench’s documentation - especially the short description of each step
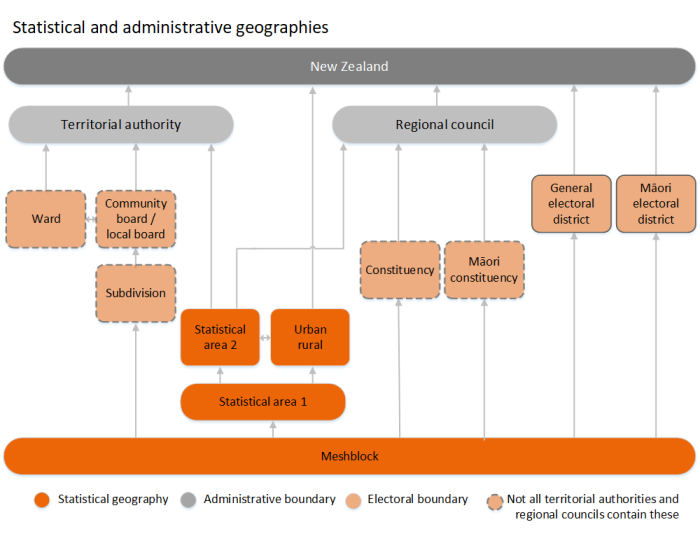
New Zealand’s geographic hierarchy
It’s a mess - Hot tip suburbs do not exist - so don’t request data by suburb

- Useful link Mashblock
- Koordinates is a great source of geographic data