Introduction to making charts with datawrapper
Get some data
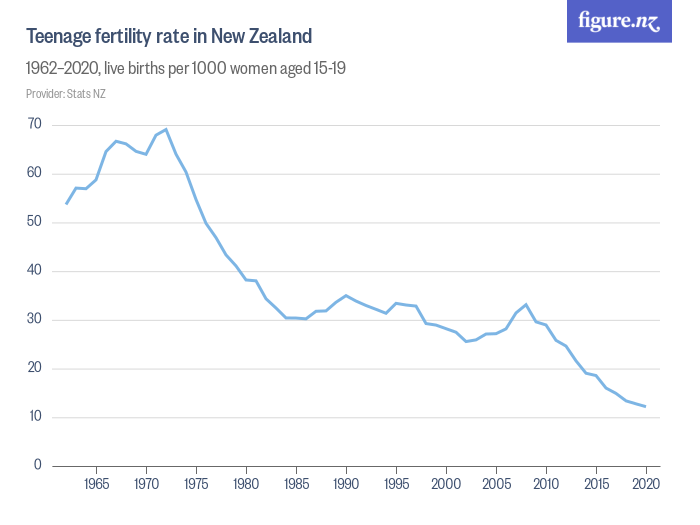
Go to Figure.NZ and search for Teenage fertility and go to this page
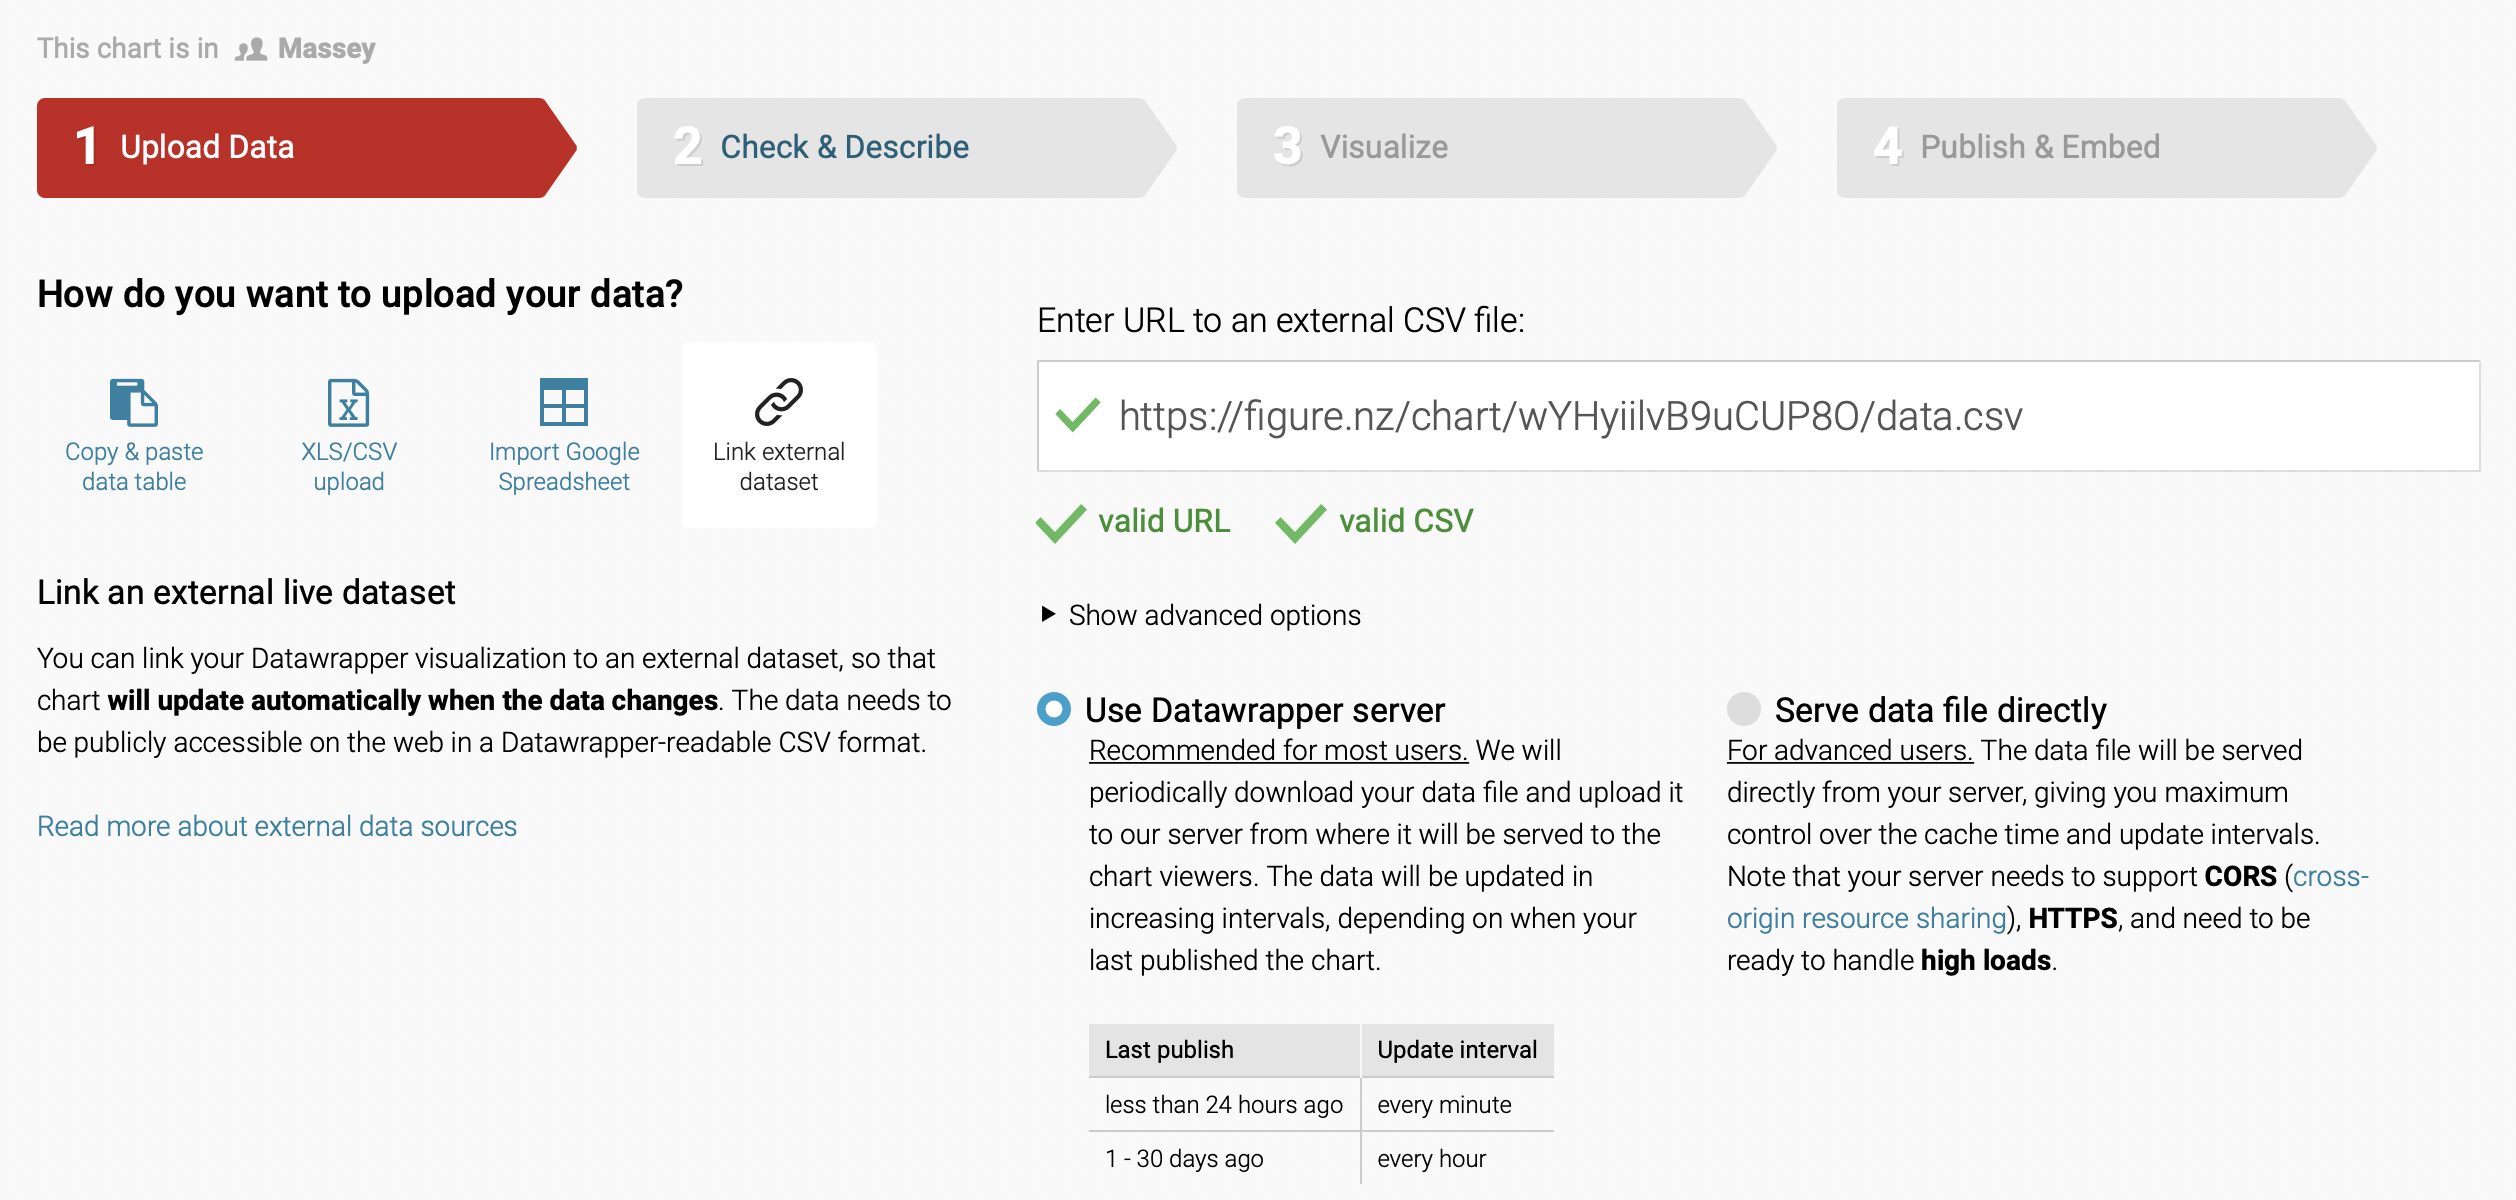
Remember the /data.csv trick - convert the url to https://figure.nz/chart/wYHyiilvB9uCUP8O/data.csv
Get the data to Datawrapper
- You can just upload - or even copy-paste - your data into Datawrapper
- But Figure.NZ +
/data.csvlets us use Datawrapper’sLink external datasetfeature
Check & Describe
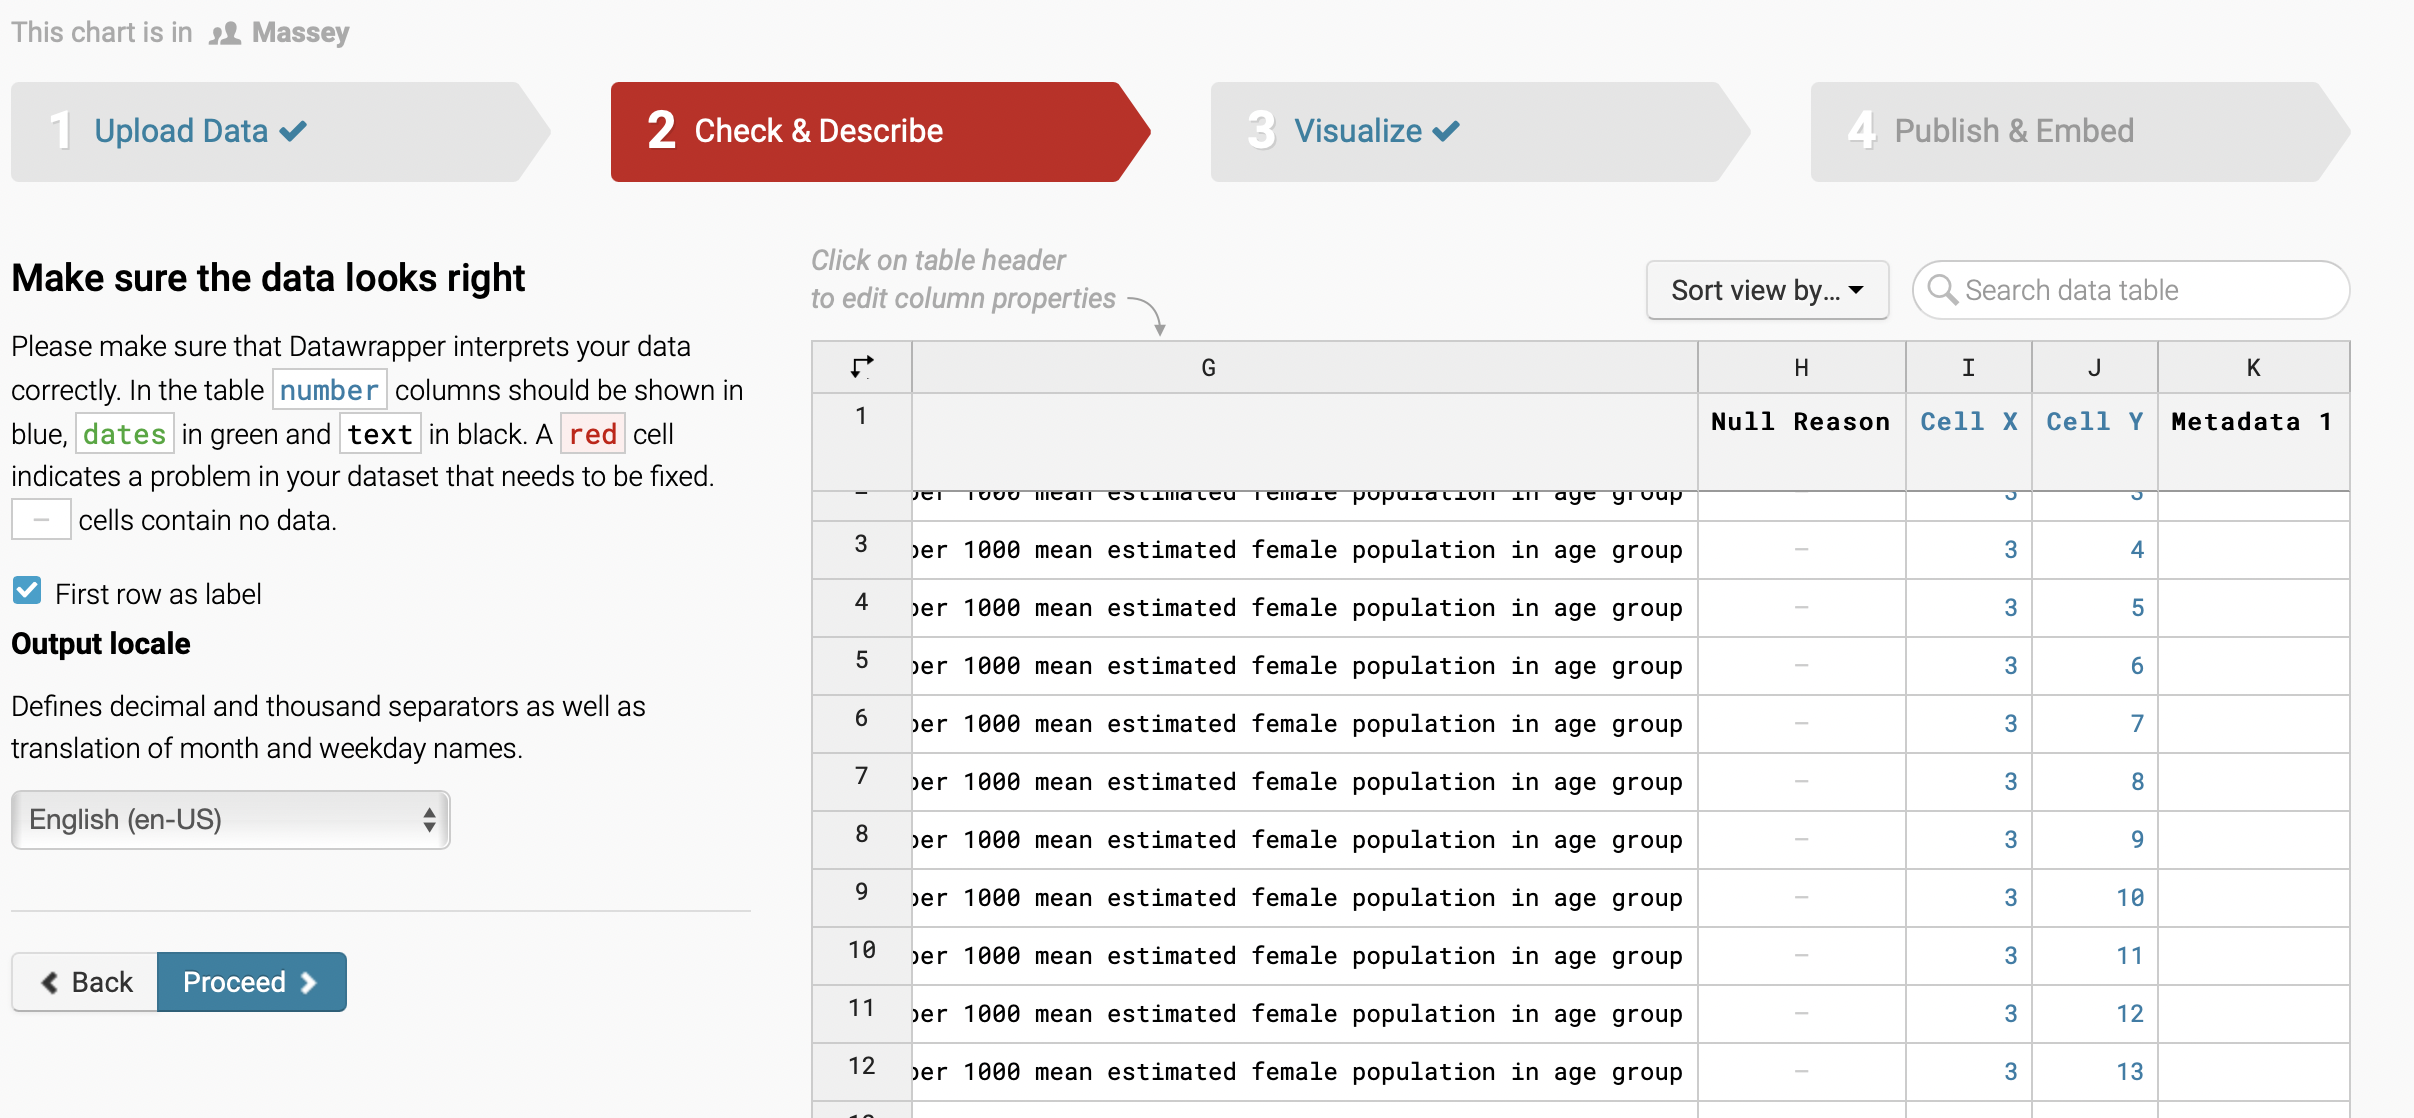
- Click through to the Check & Describe tab
The Check & Describe tab is often where things go wrong
But the easiest way to see if they are correct is just to carry on
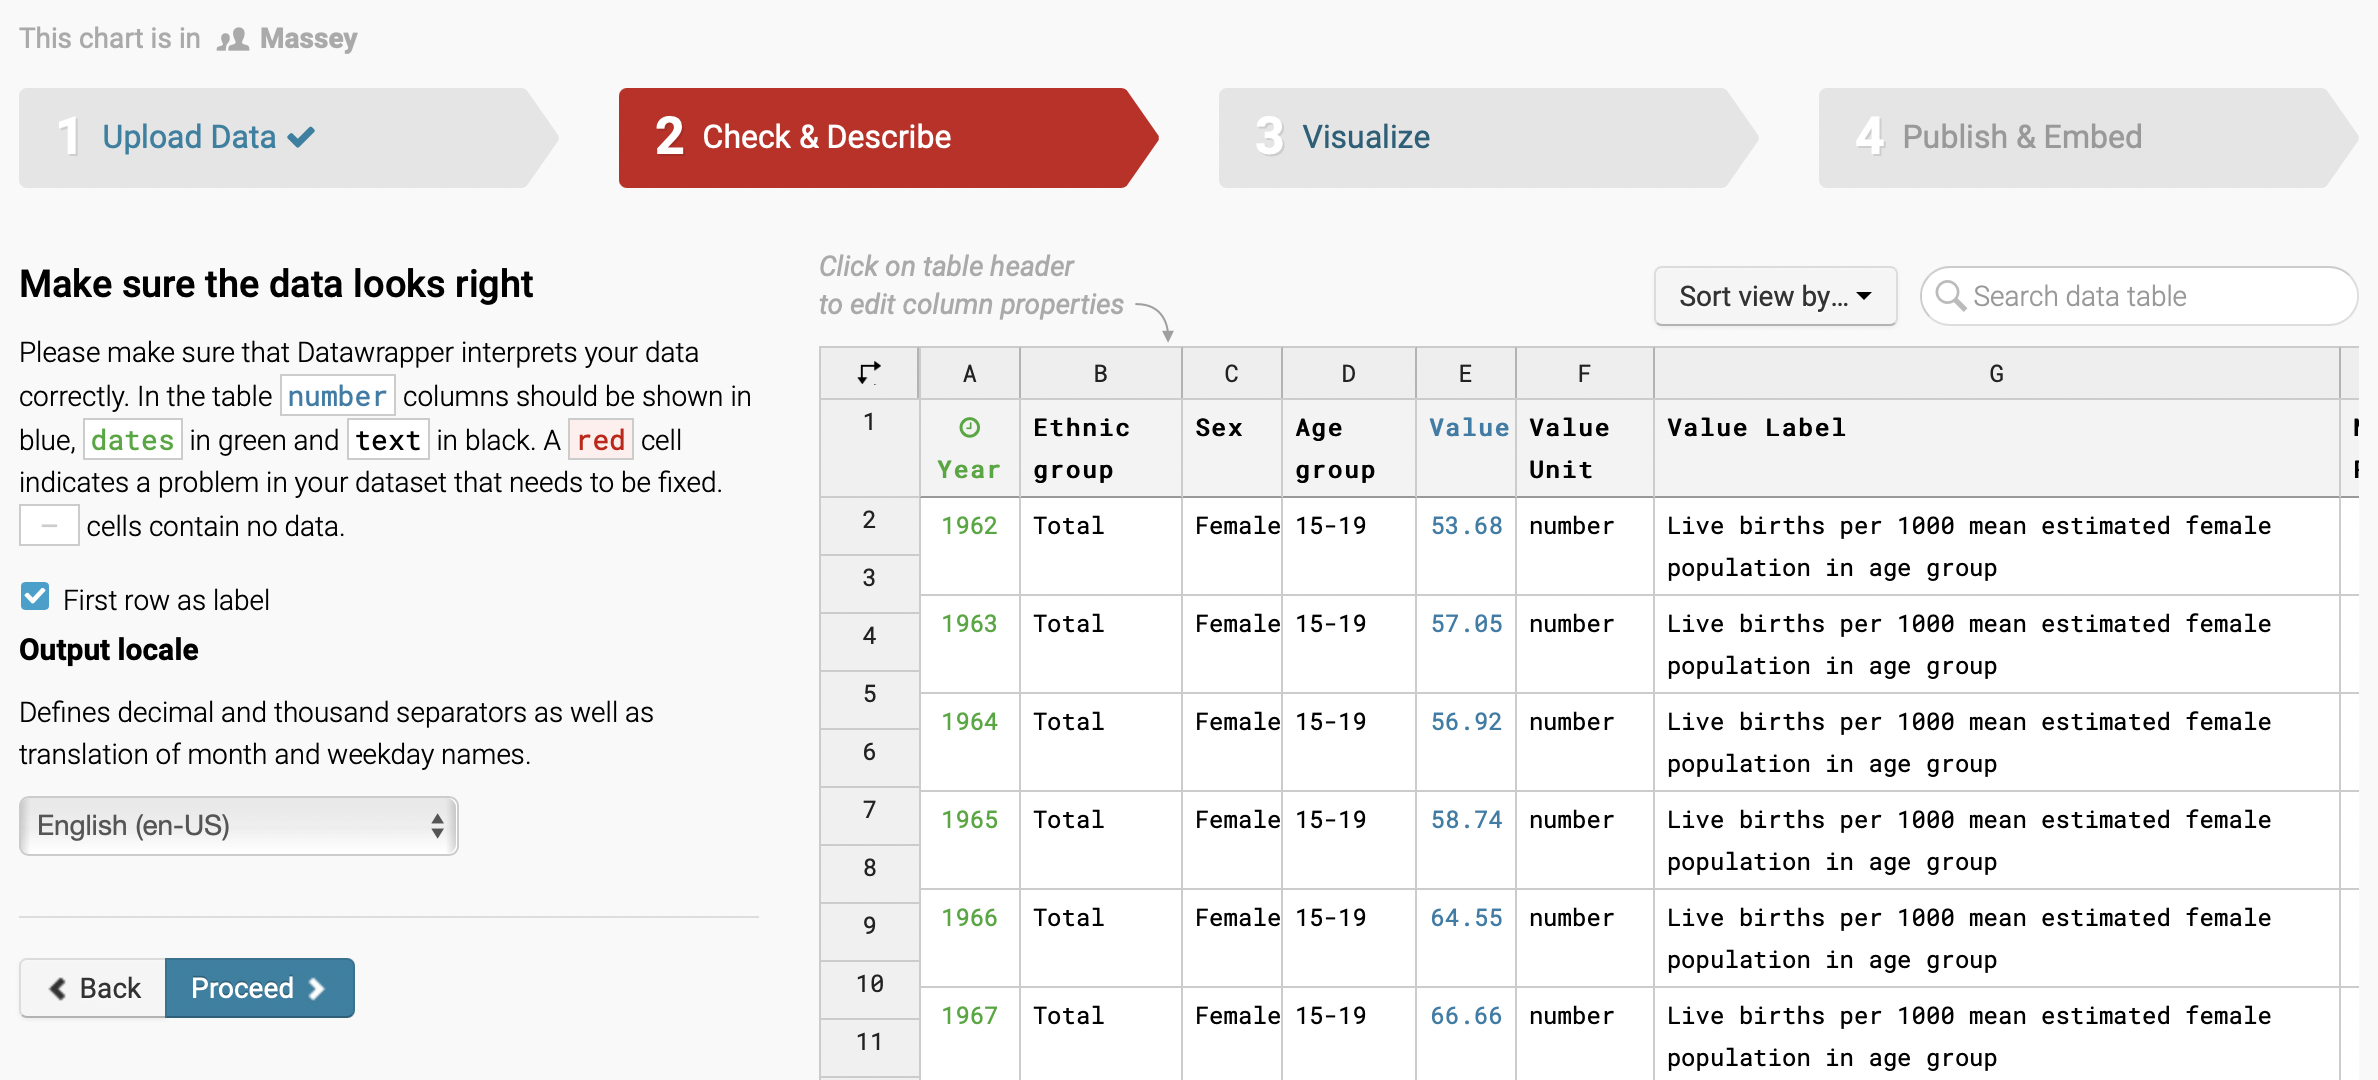
- As the prompt says make sure your dates are green and your numbers are blue
Whoops
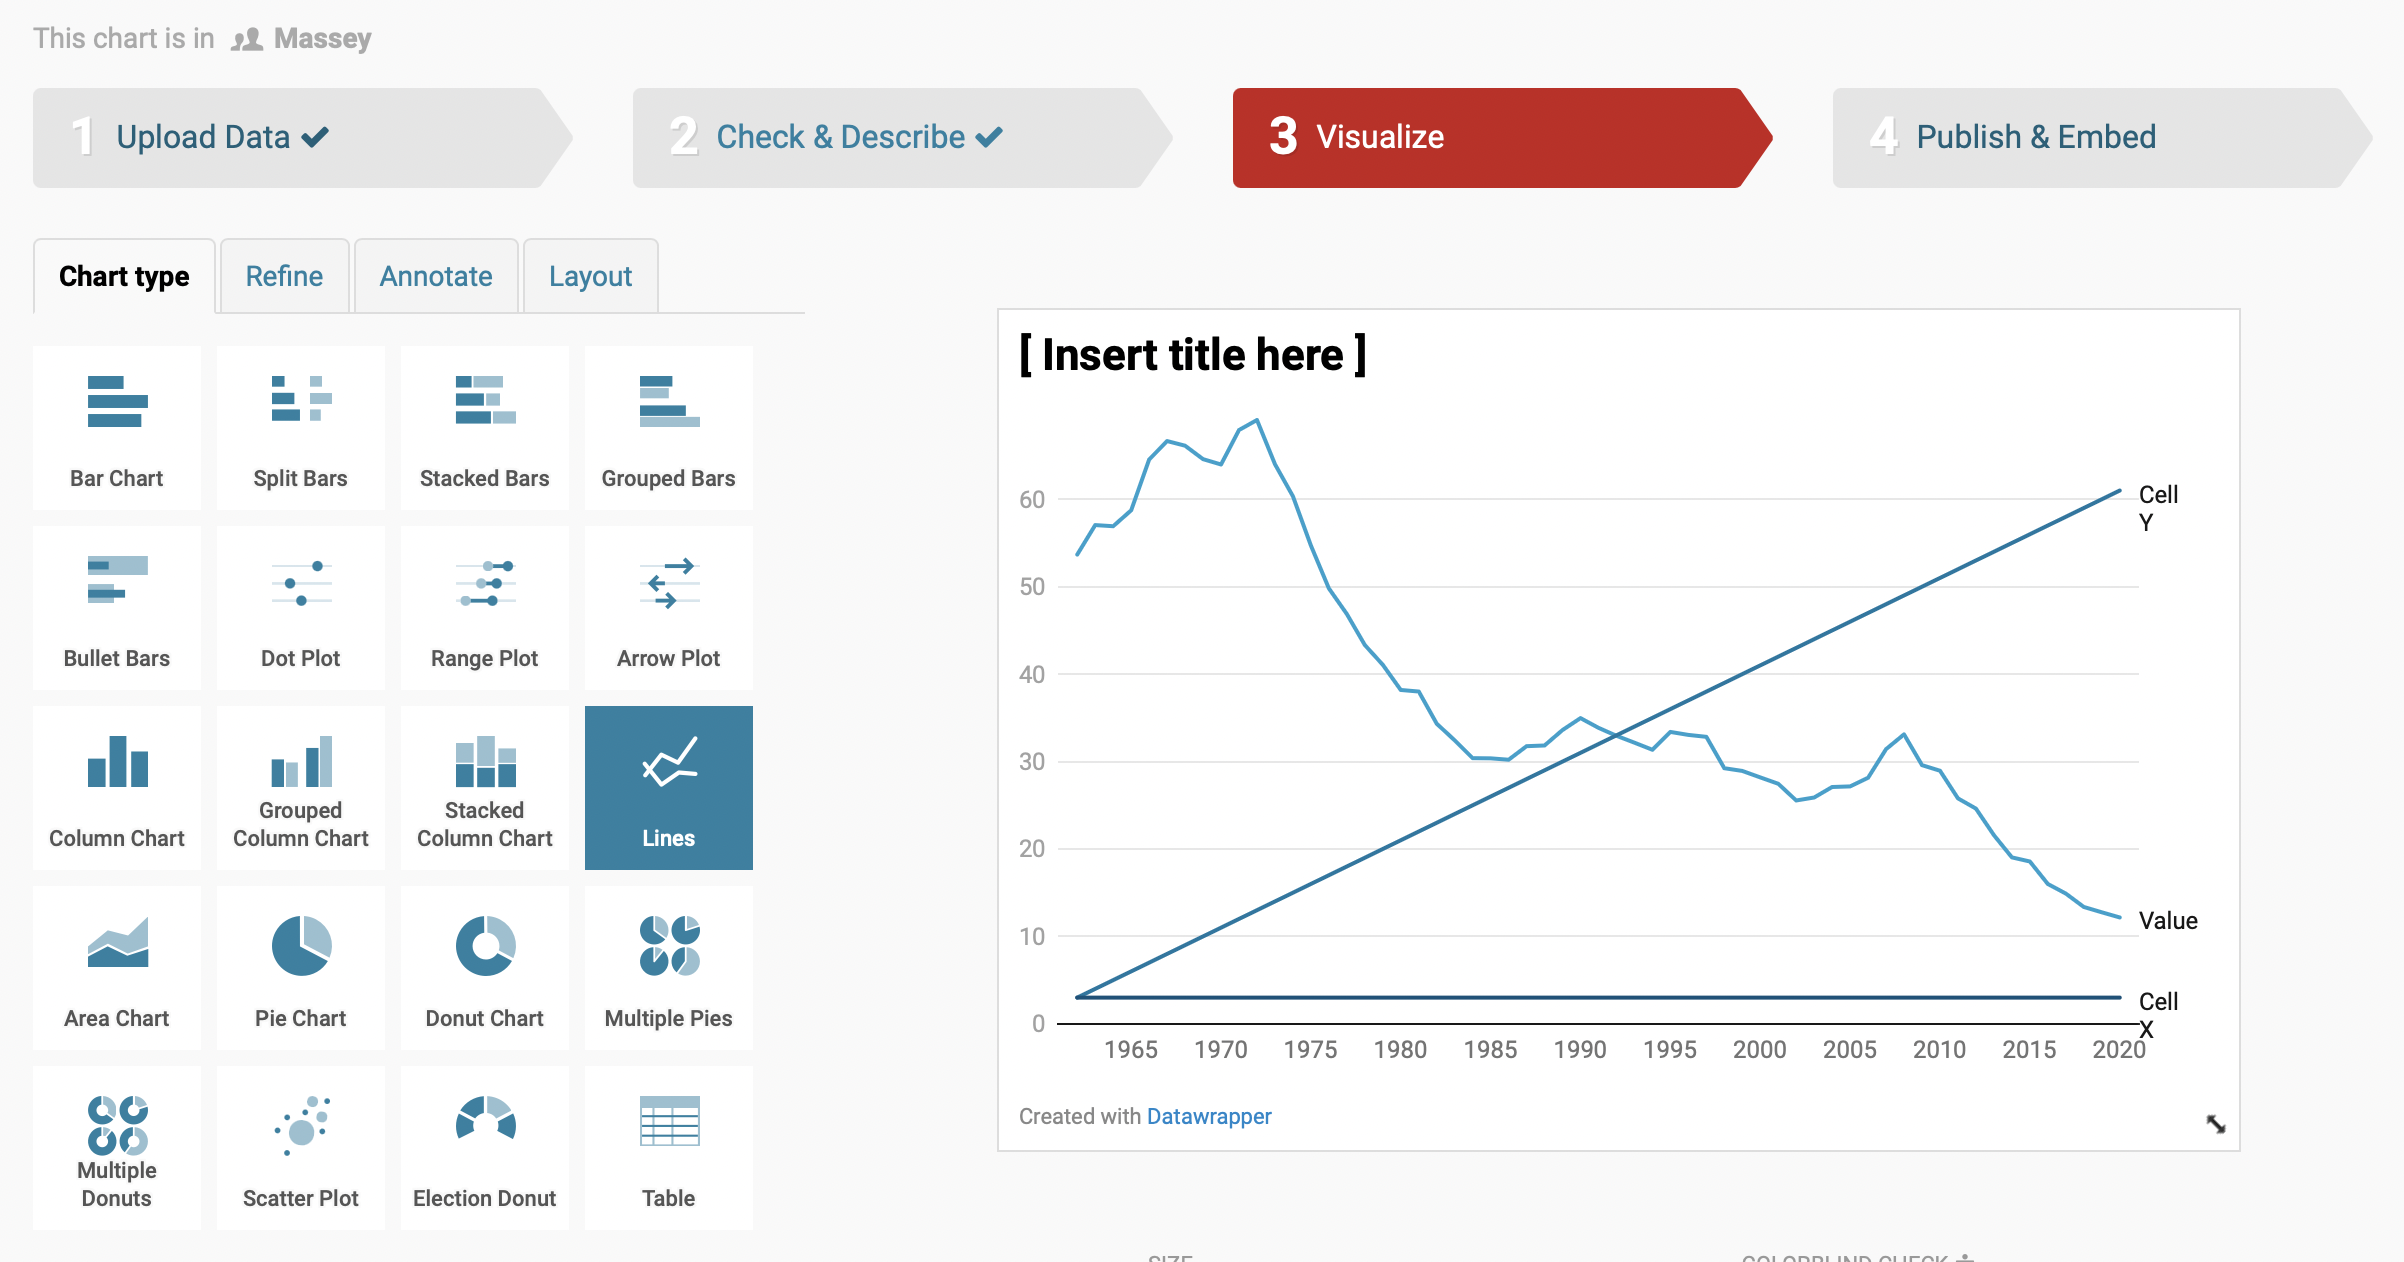
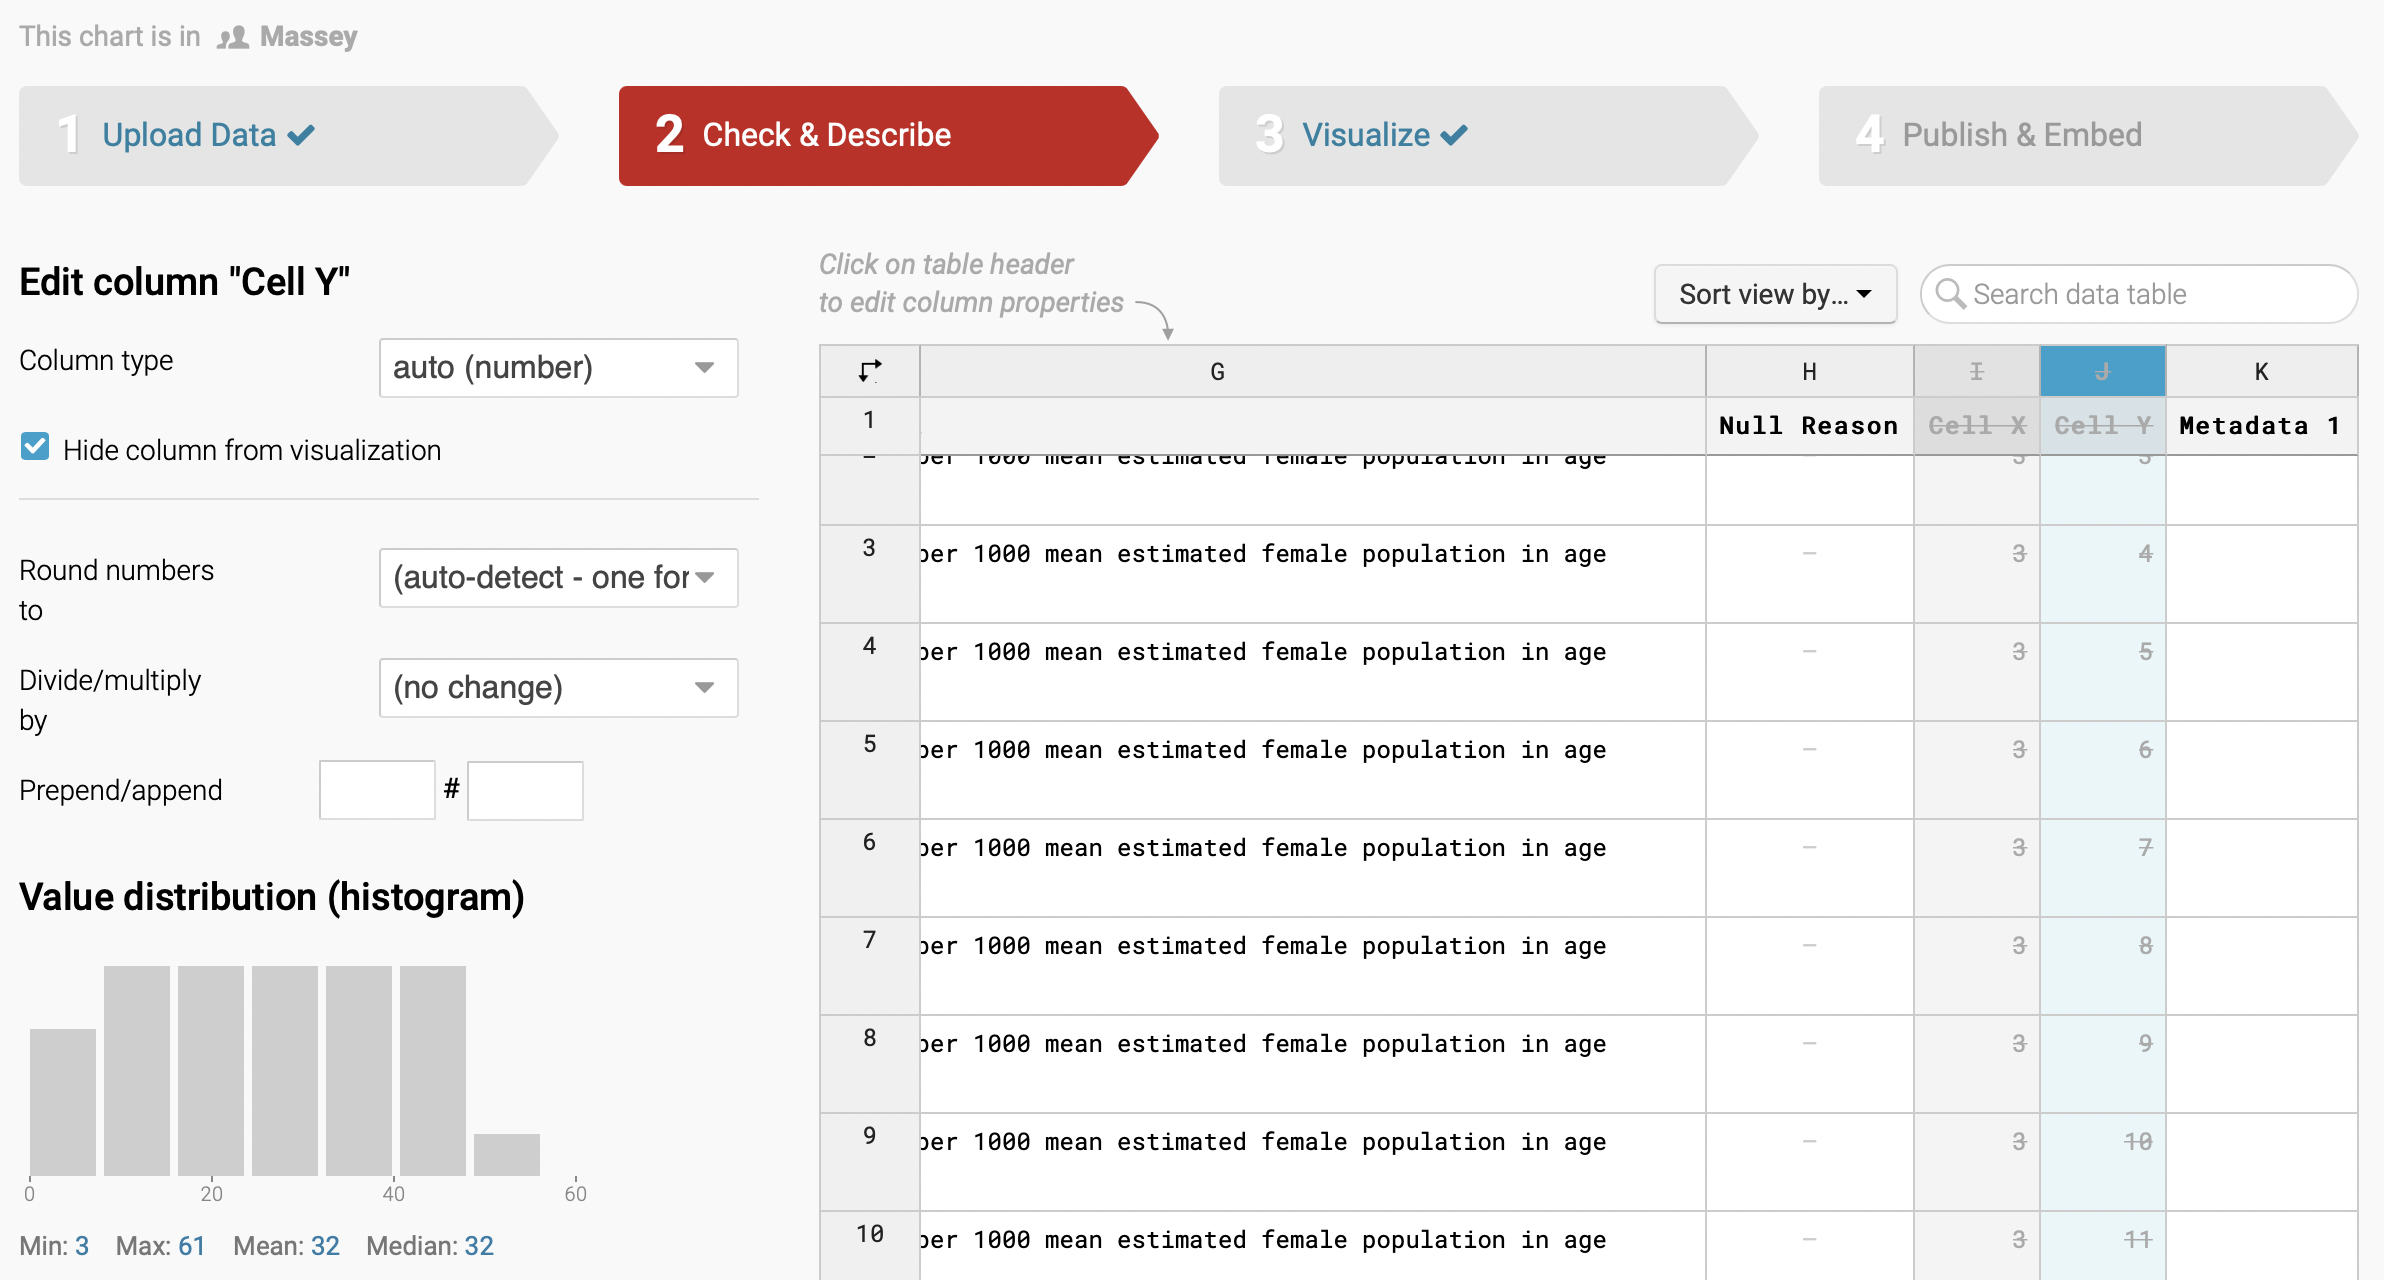
Head back to Check & Describe and look for columns called Cell X and Cell Y
The Datawrapper extract includes some meta-data to keep track of where the data came from. Hide those columns.
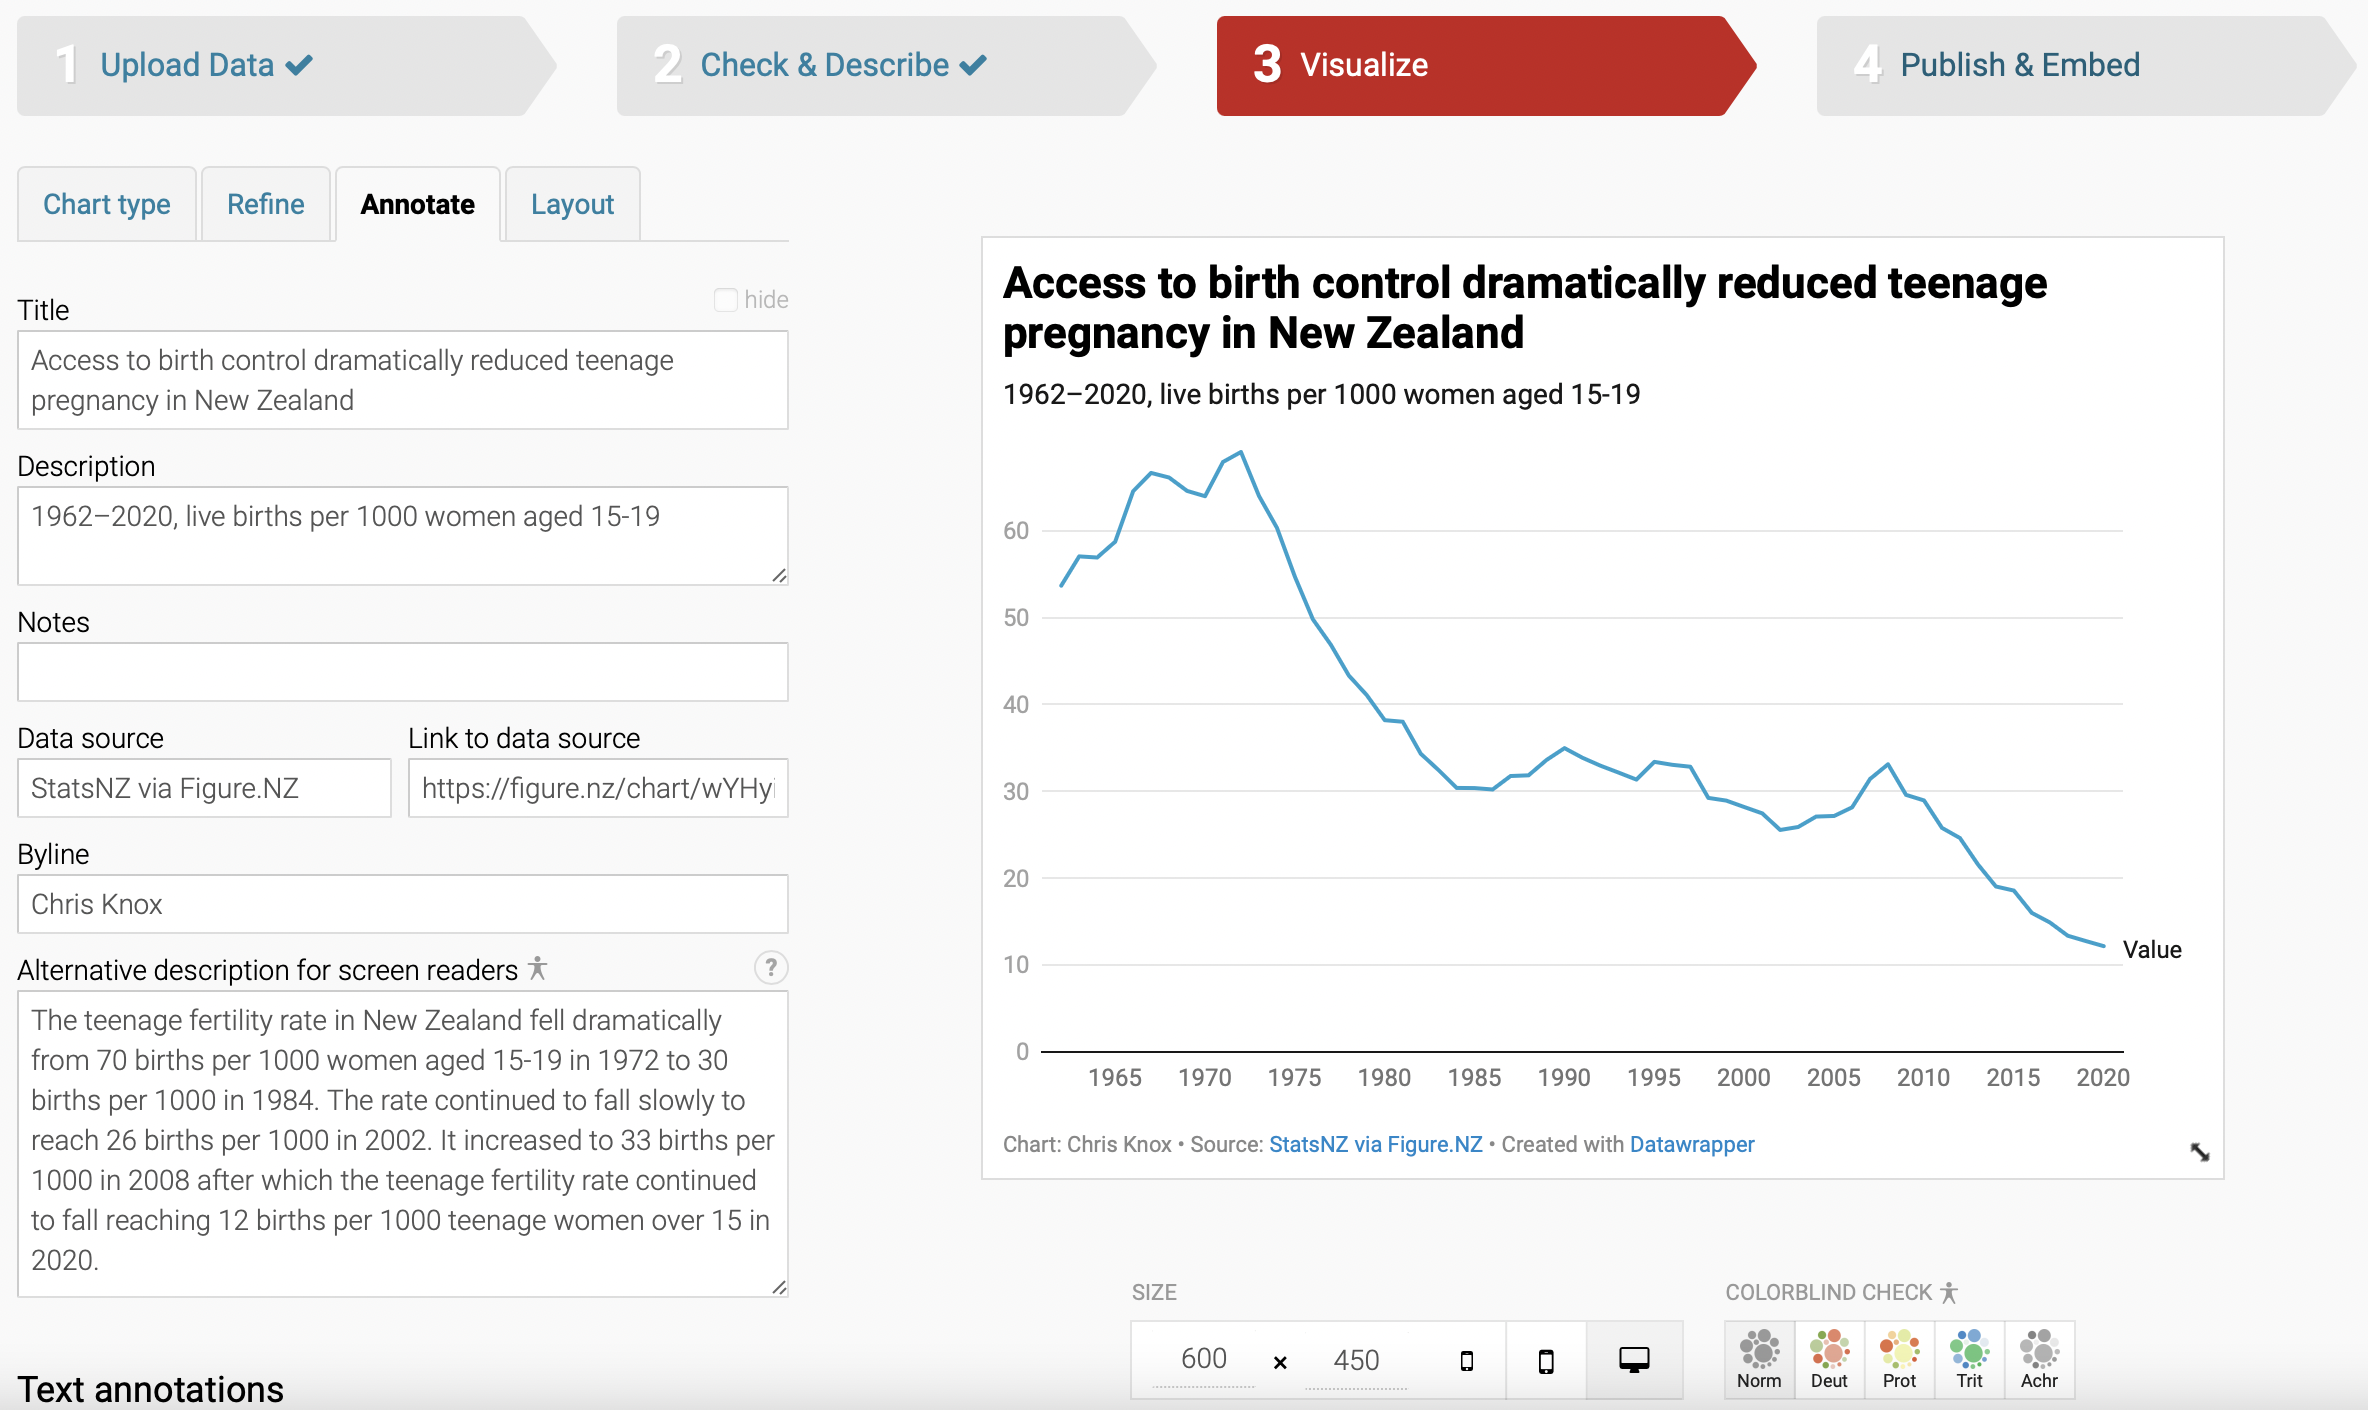
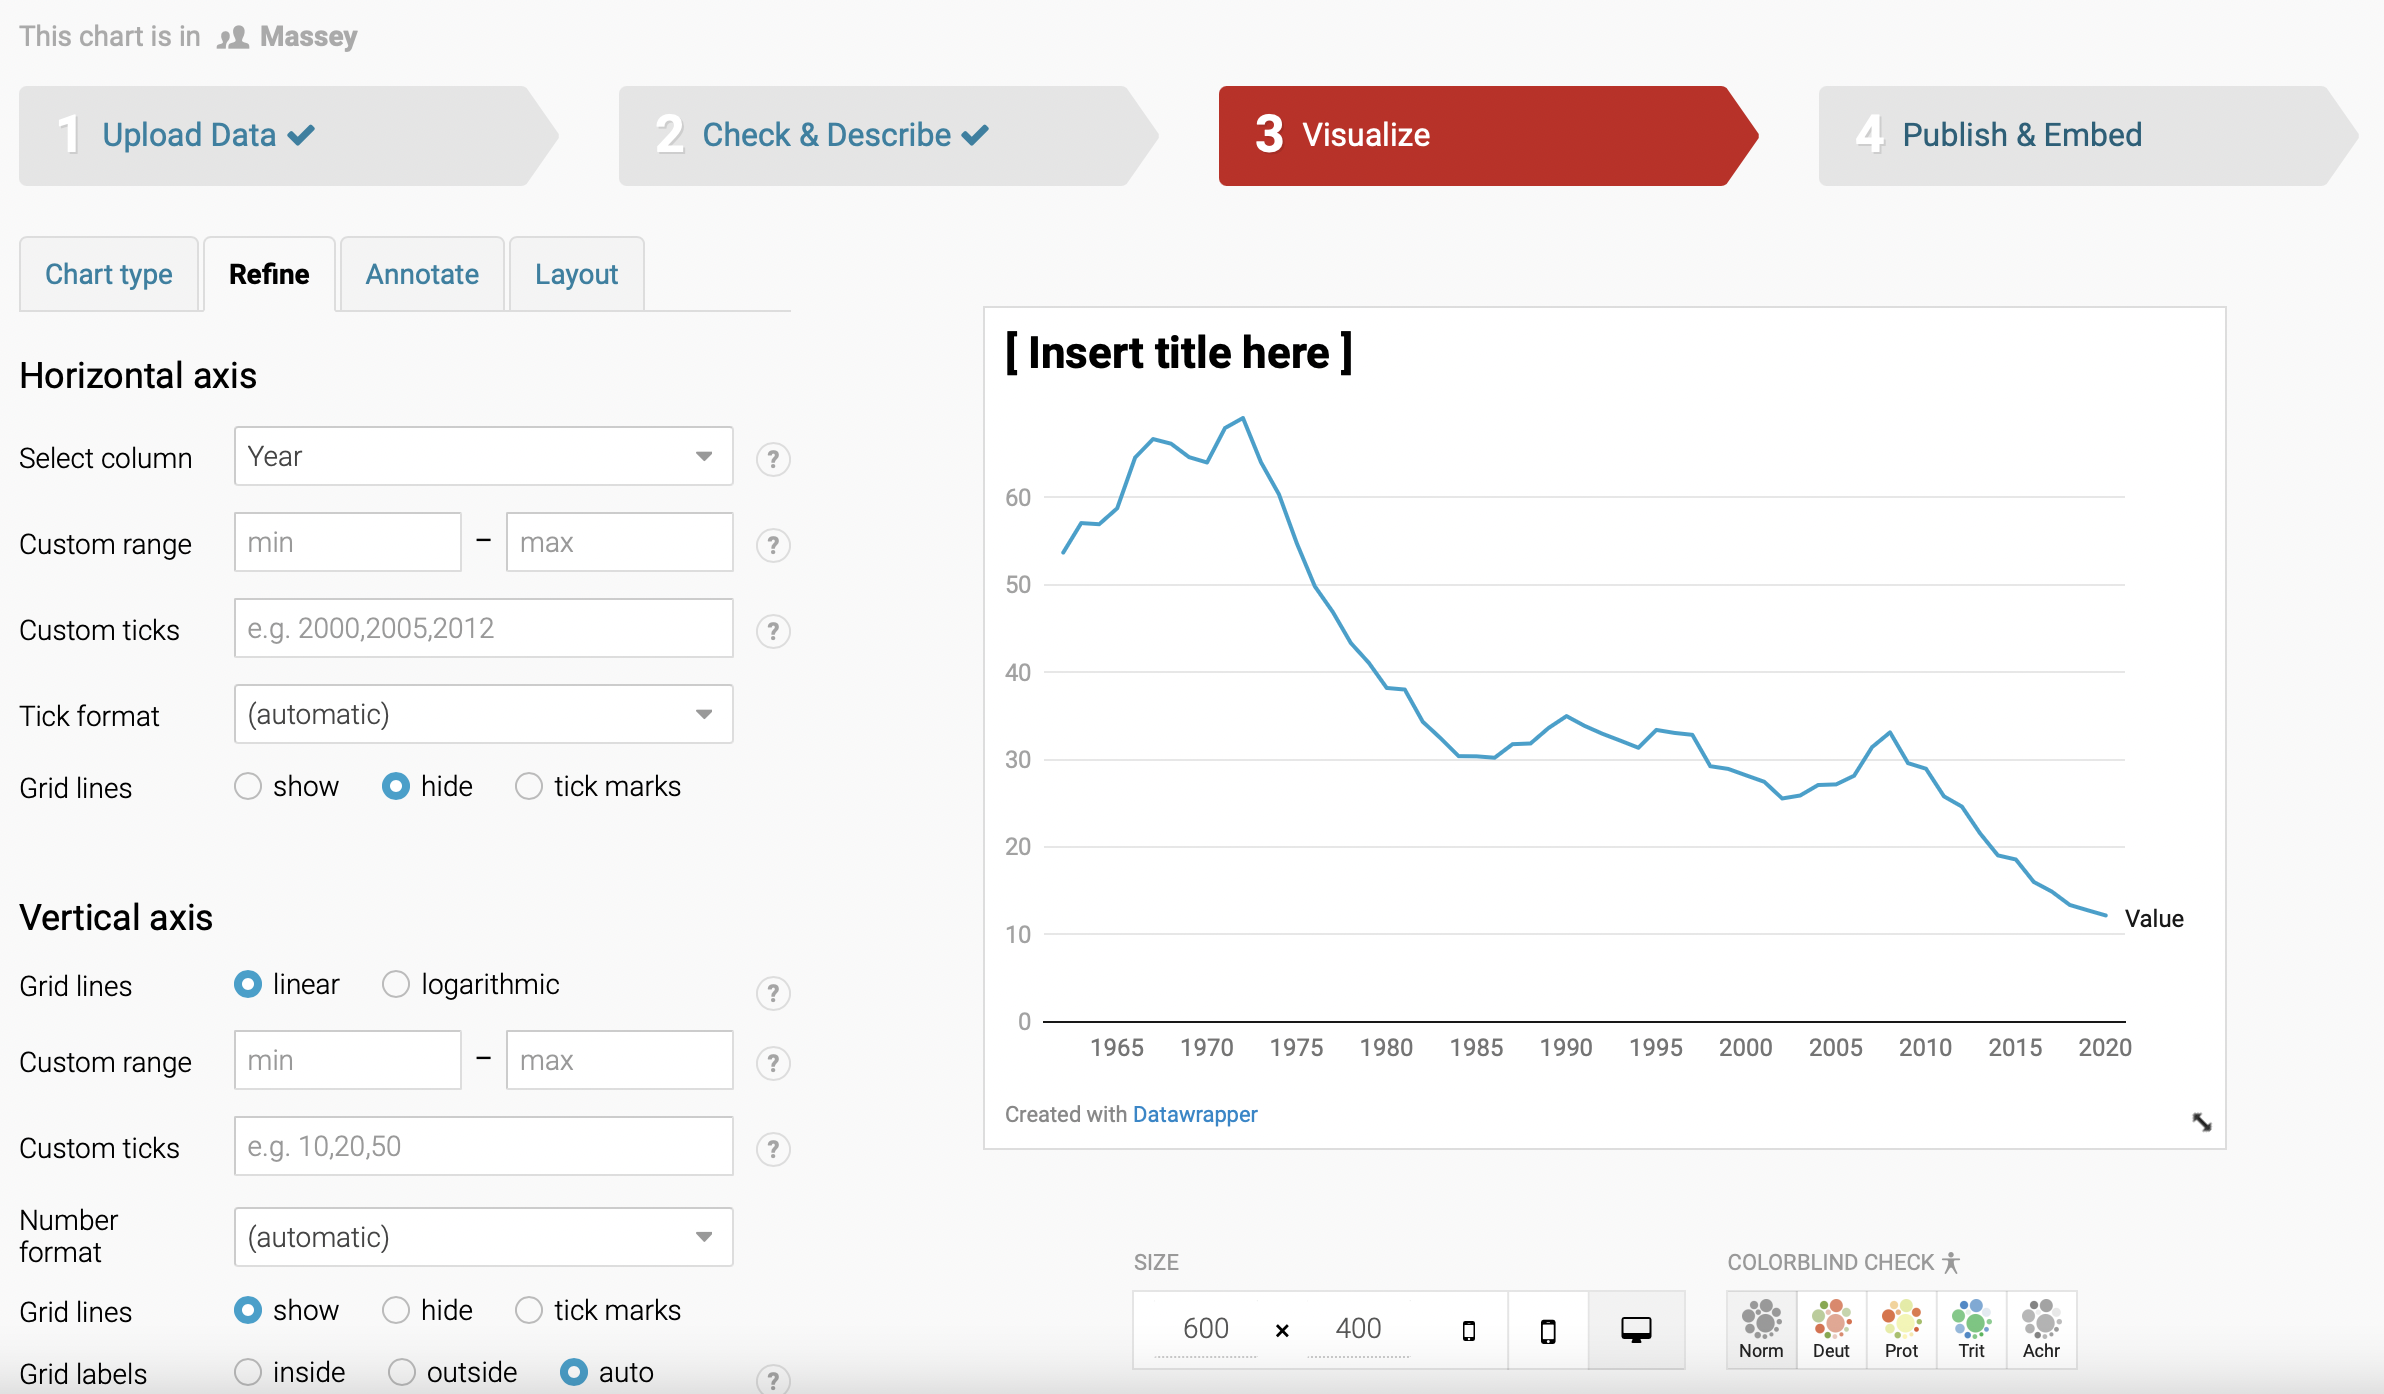
And head back to the Visualize tab
Finally
That looks more like it
Writing time
- Getting the data into a chart is only the beginning
- There are things to play with the improve the visual appearance of your chart
- Or to make it worse or misleading
- But focus on your words first
- Why should readers look at this chart?
- What story is the chart telling?
Start with the alt text